Visualizing Data on Surveillance Technology
QUESTION
What can data tell us about the state of surveillance technology?
GOAL
Present to unfamiliar audiences the state and dangers of the rise of surveillance technology.
Project Overview
For a class exhibition, I found, analyzed, and visualized data on AI surveillance technology. I am passionate about privacy rights in the digital age, but believe that the technological complexity hinders the public from understanding the rights and risks they face. Data visualization allowed me to identify and visually convey the current dangers and uses for unfamiliar audiences.
The Process
The Search for Data
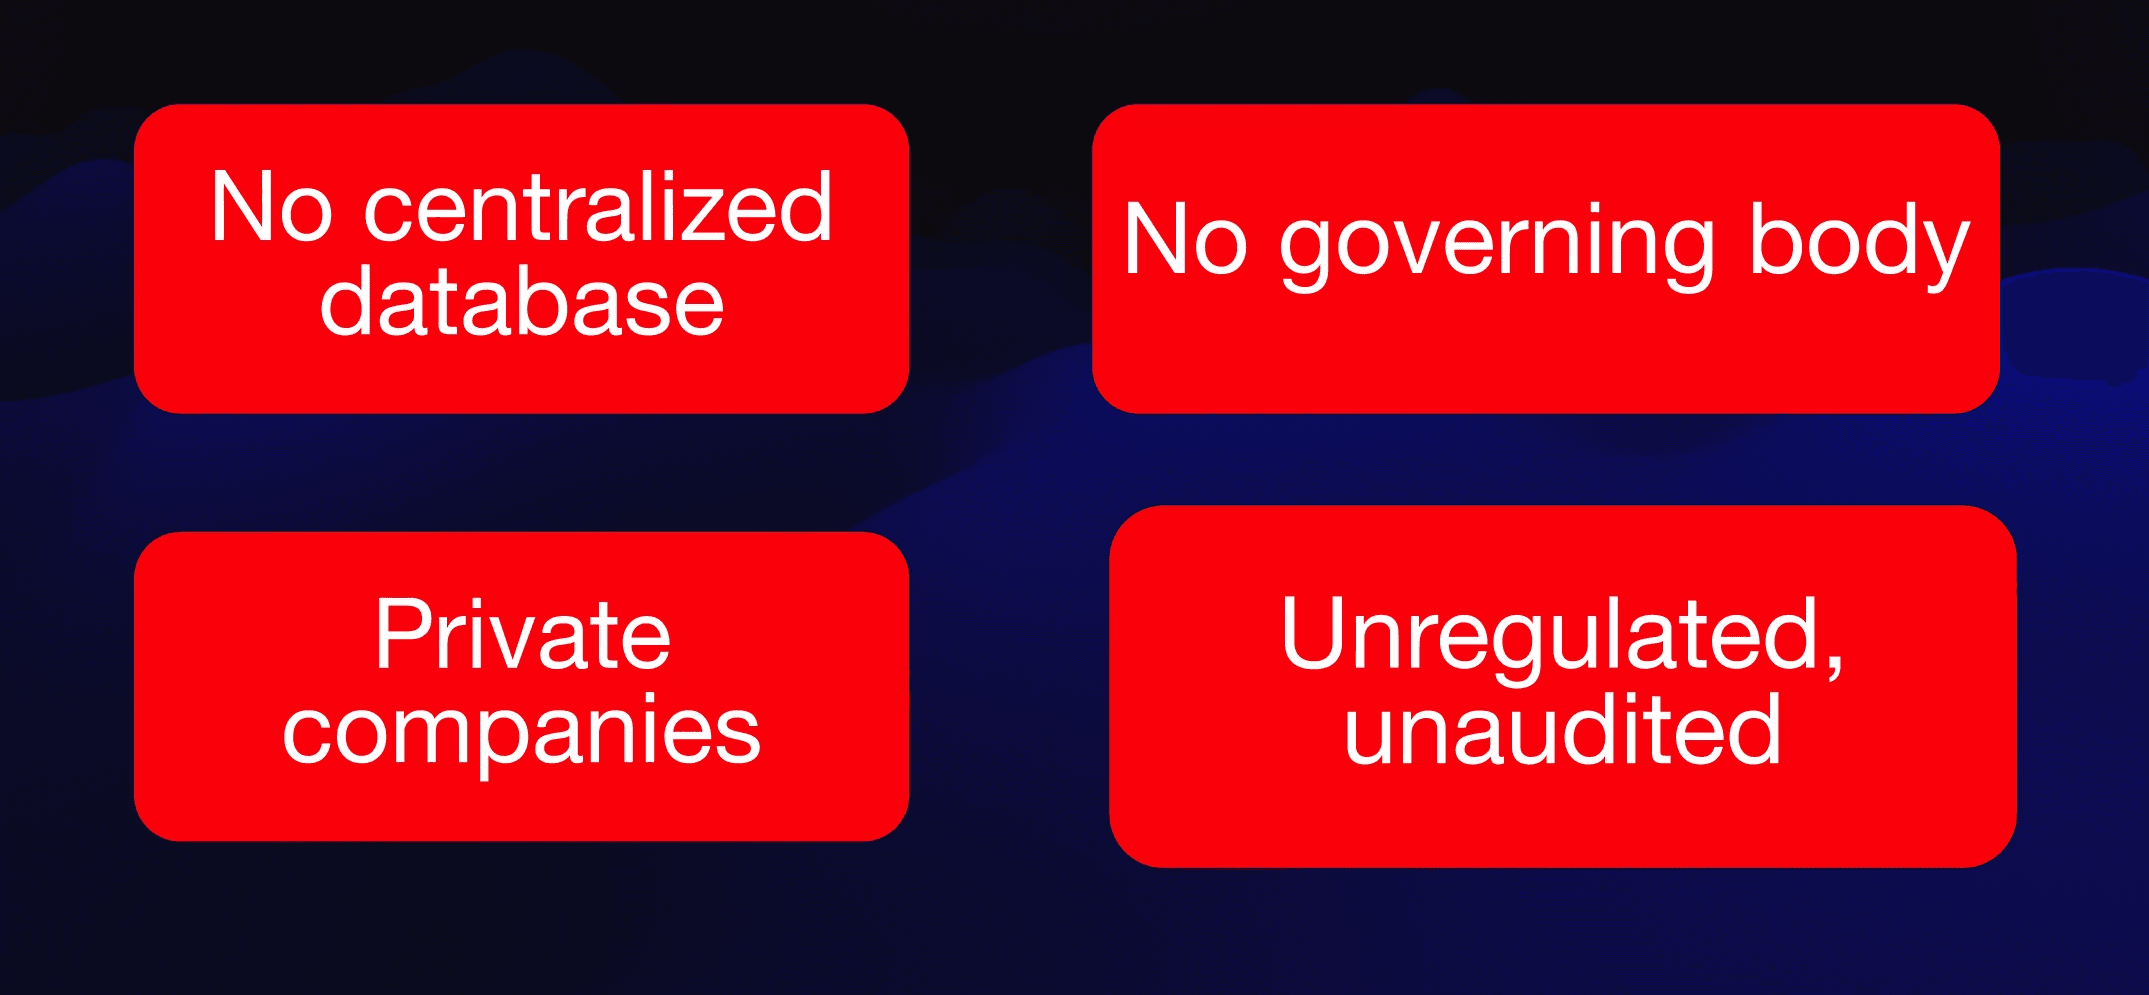
I knew I wanted to investigate surveillance technology, but I had no idea how hard it would be to find data on it. Why?
The Atlas of Surveillance
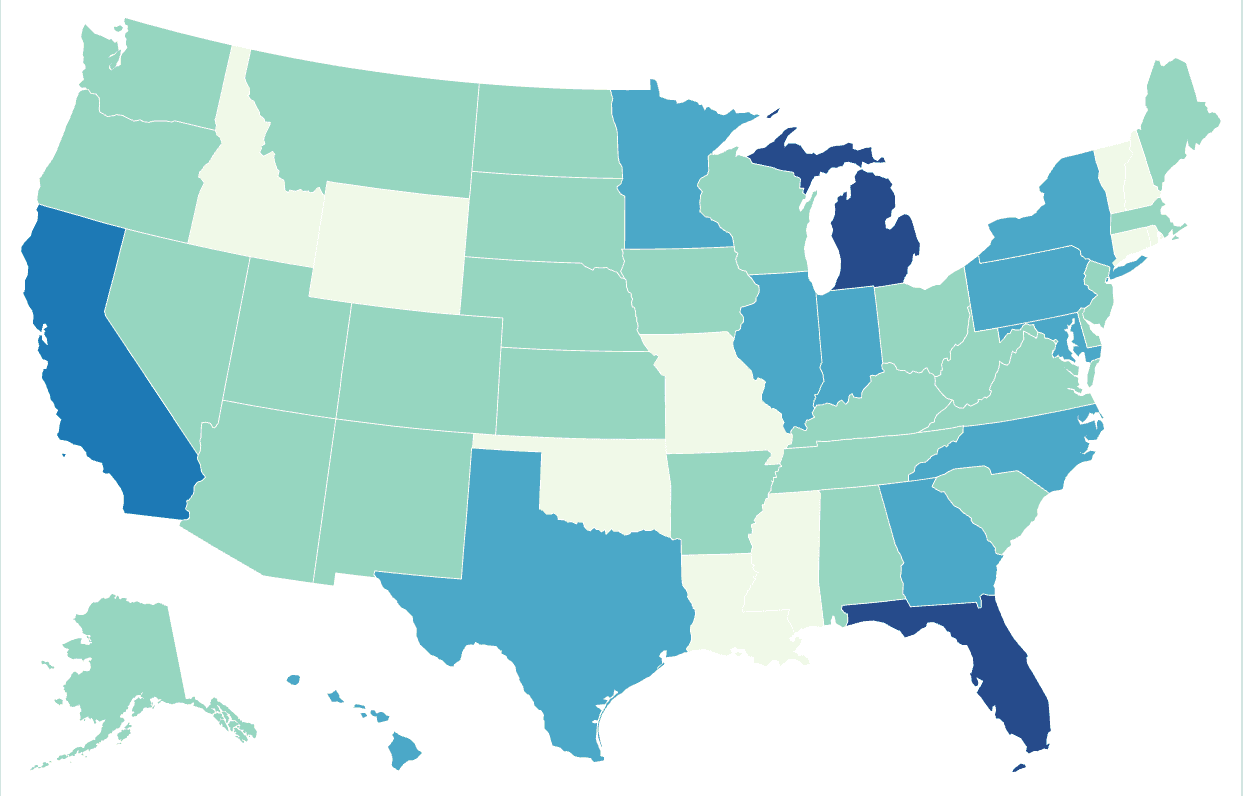
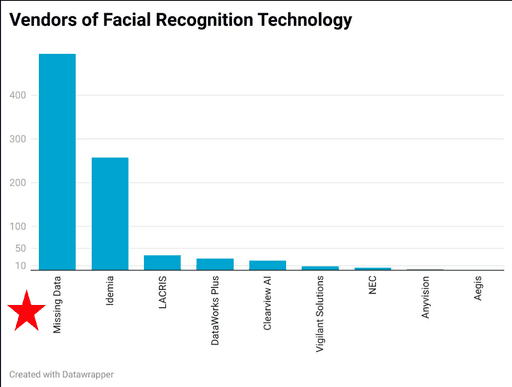
The Atlas of Surveillance, a crowdsourced, publicly-researched, public dataset had the most to offer, but there was a lot missing data.
I chose to embrace the unknowns - the missing data only underscored how important the story was.
Analyzing the Data
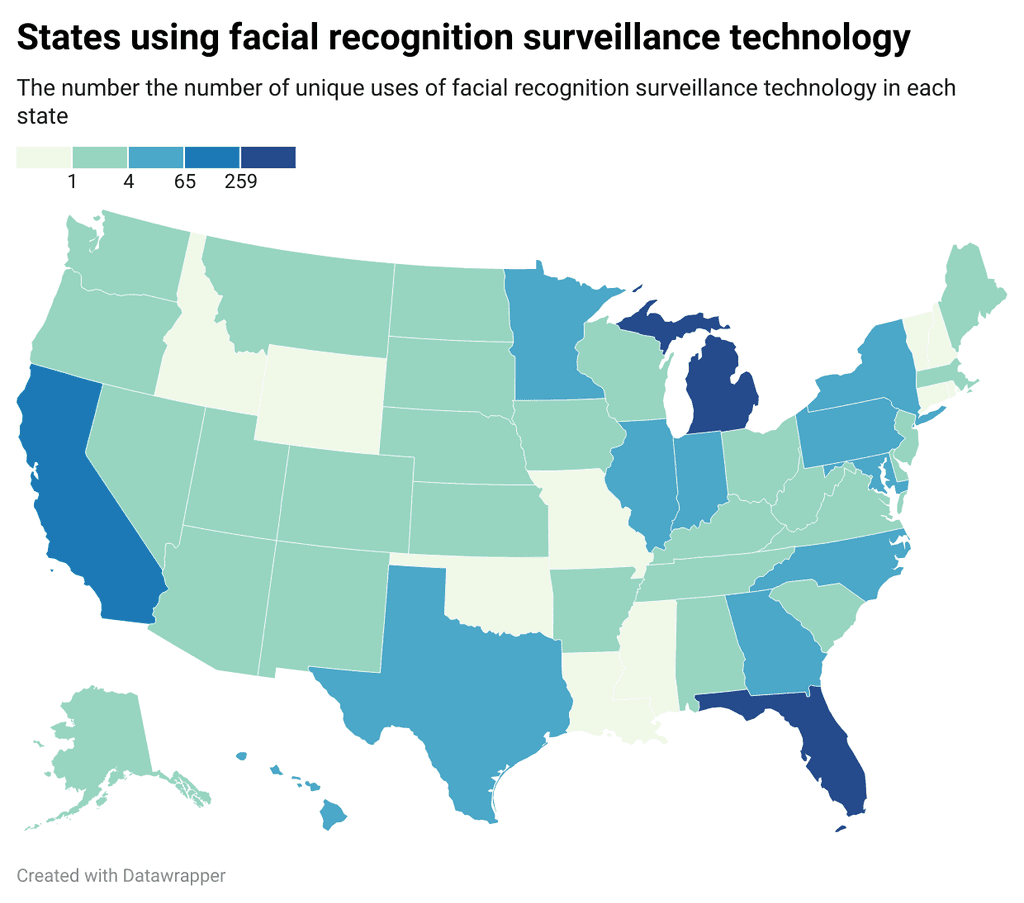
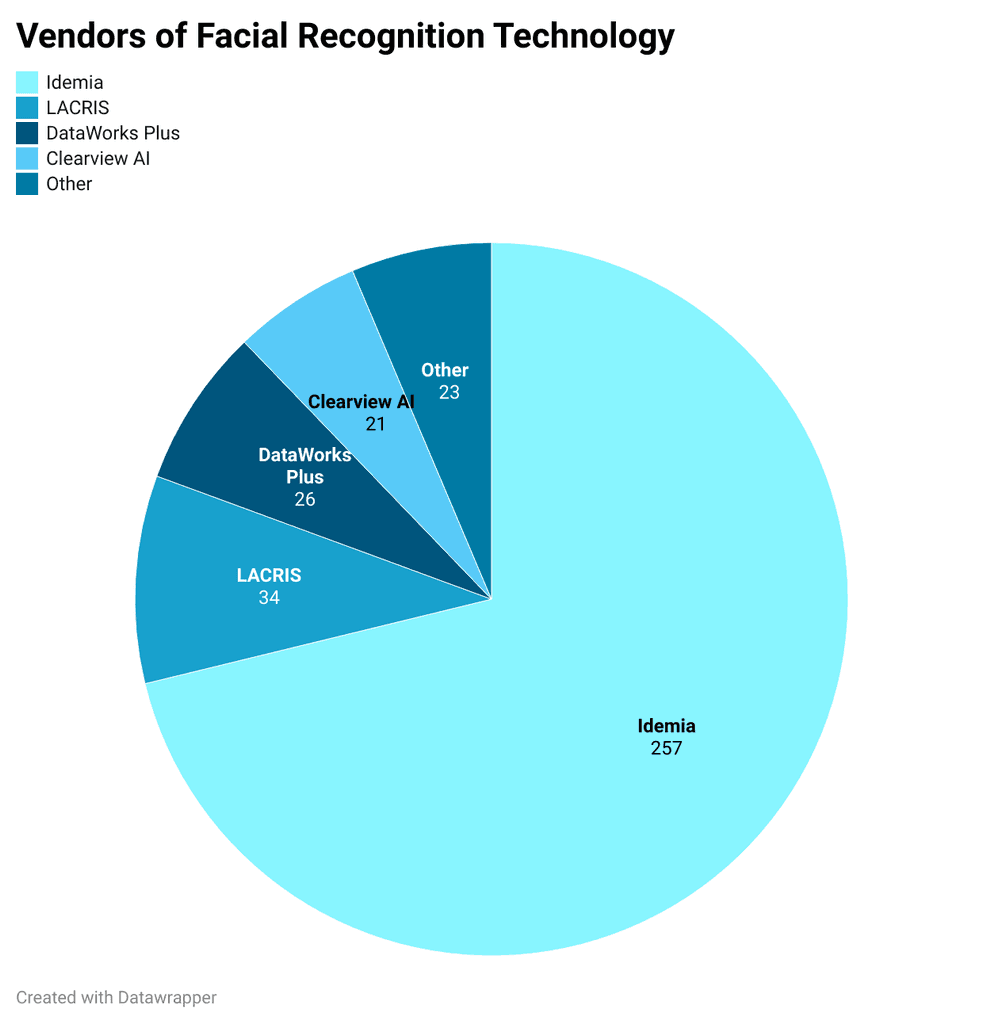
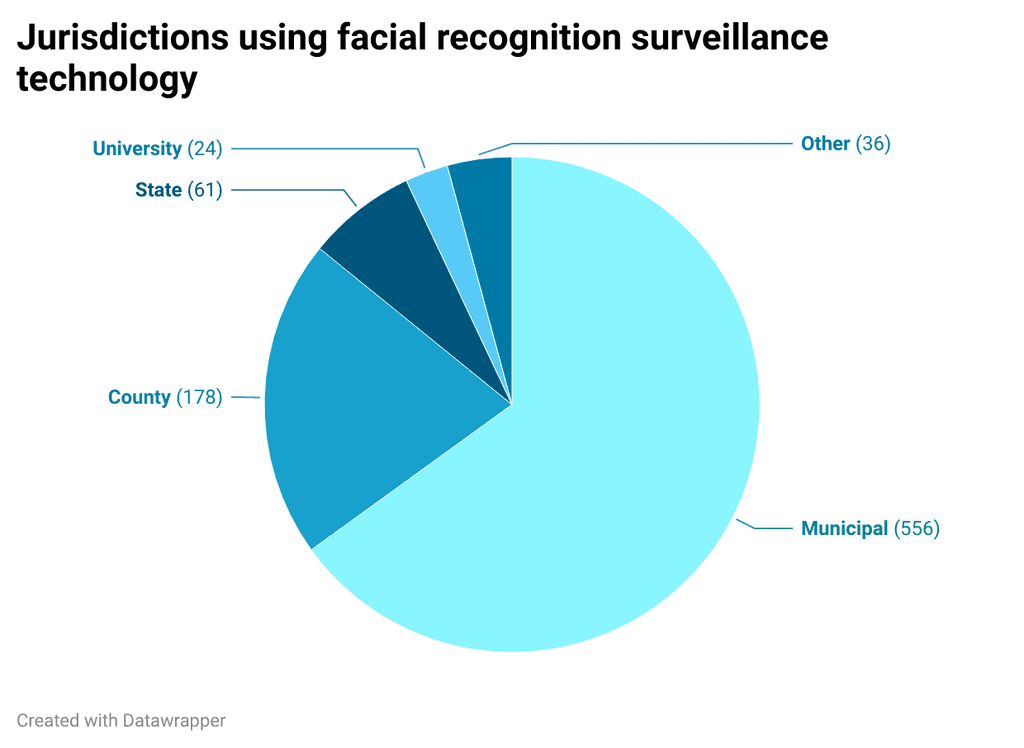
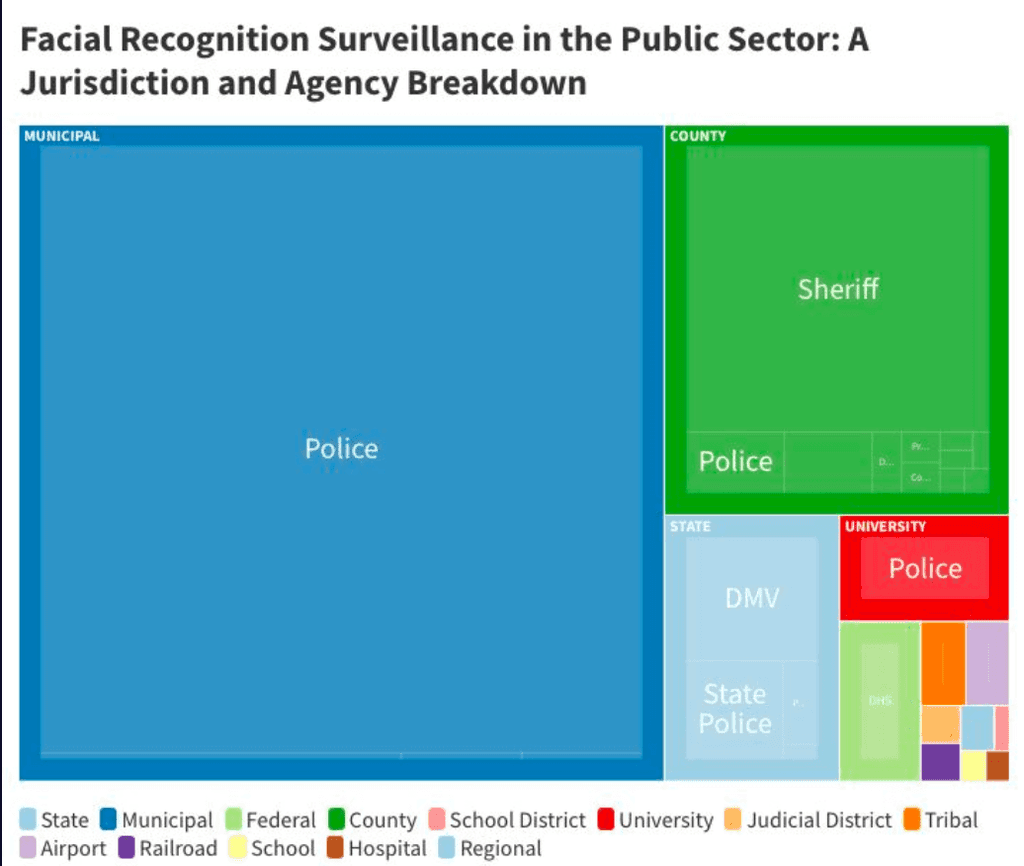
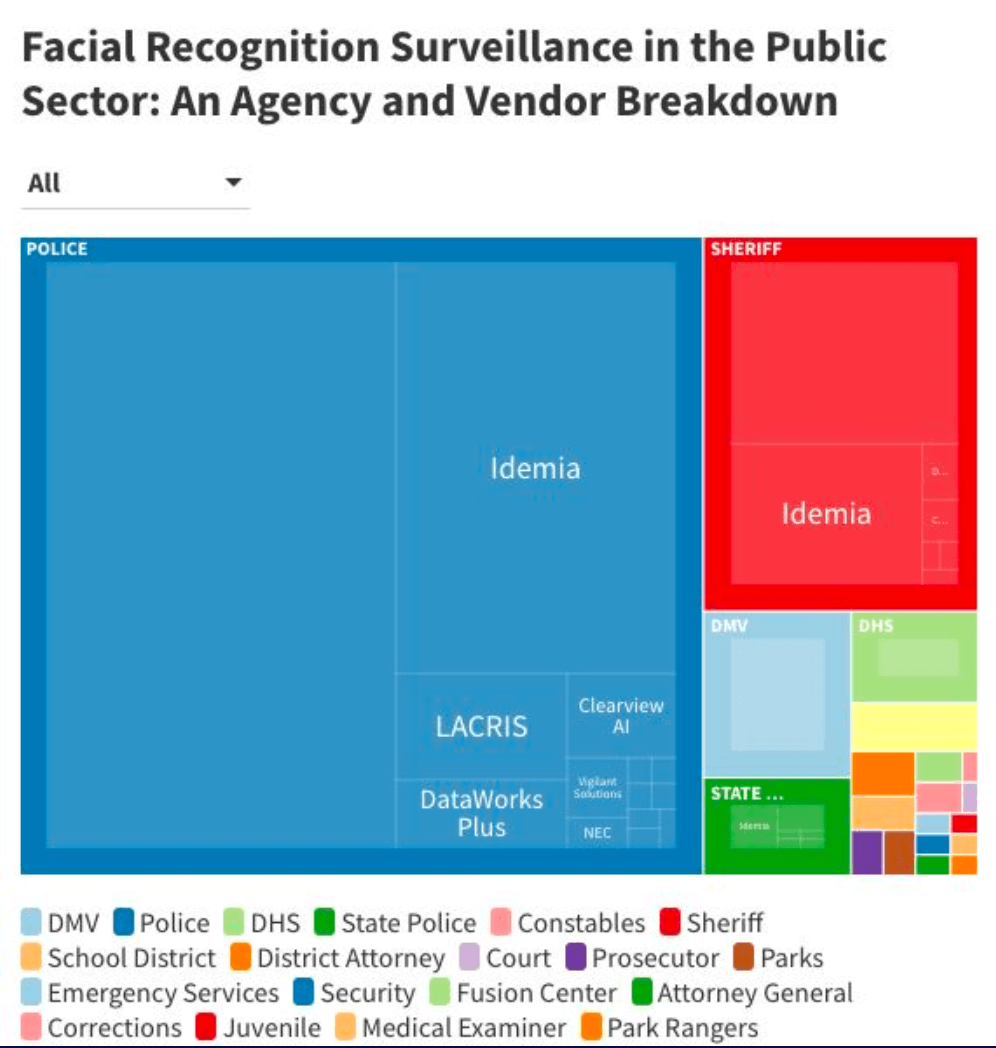
Over and over, I saw the word "police". Using my skills in Excel, I cross-referenced and analyzed sections of data to conclude that, indeed, police were using surveillance technology more than any other government agencies.
Visualizing the Data
I used Datawrapper to create and design graphics to highlight my most important findings.
Telling the Story
Finally, I presented my findings to a group of journalism students without much knowledge on the technology.
I underscored the power of journalism to help regulate the use of this dangerous technology.
